


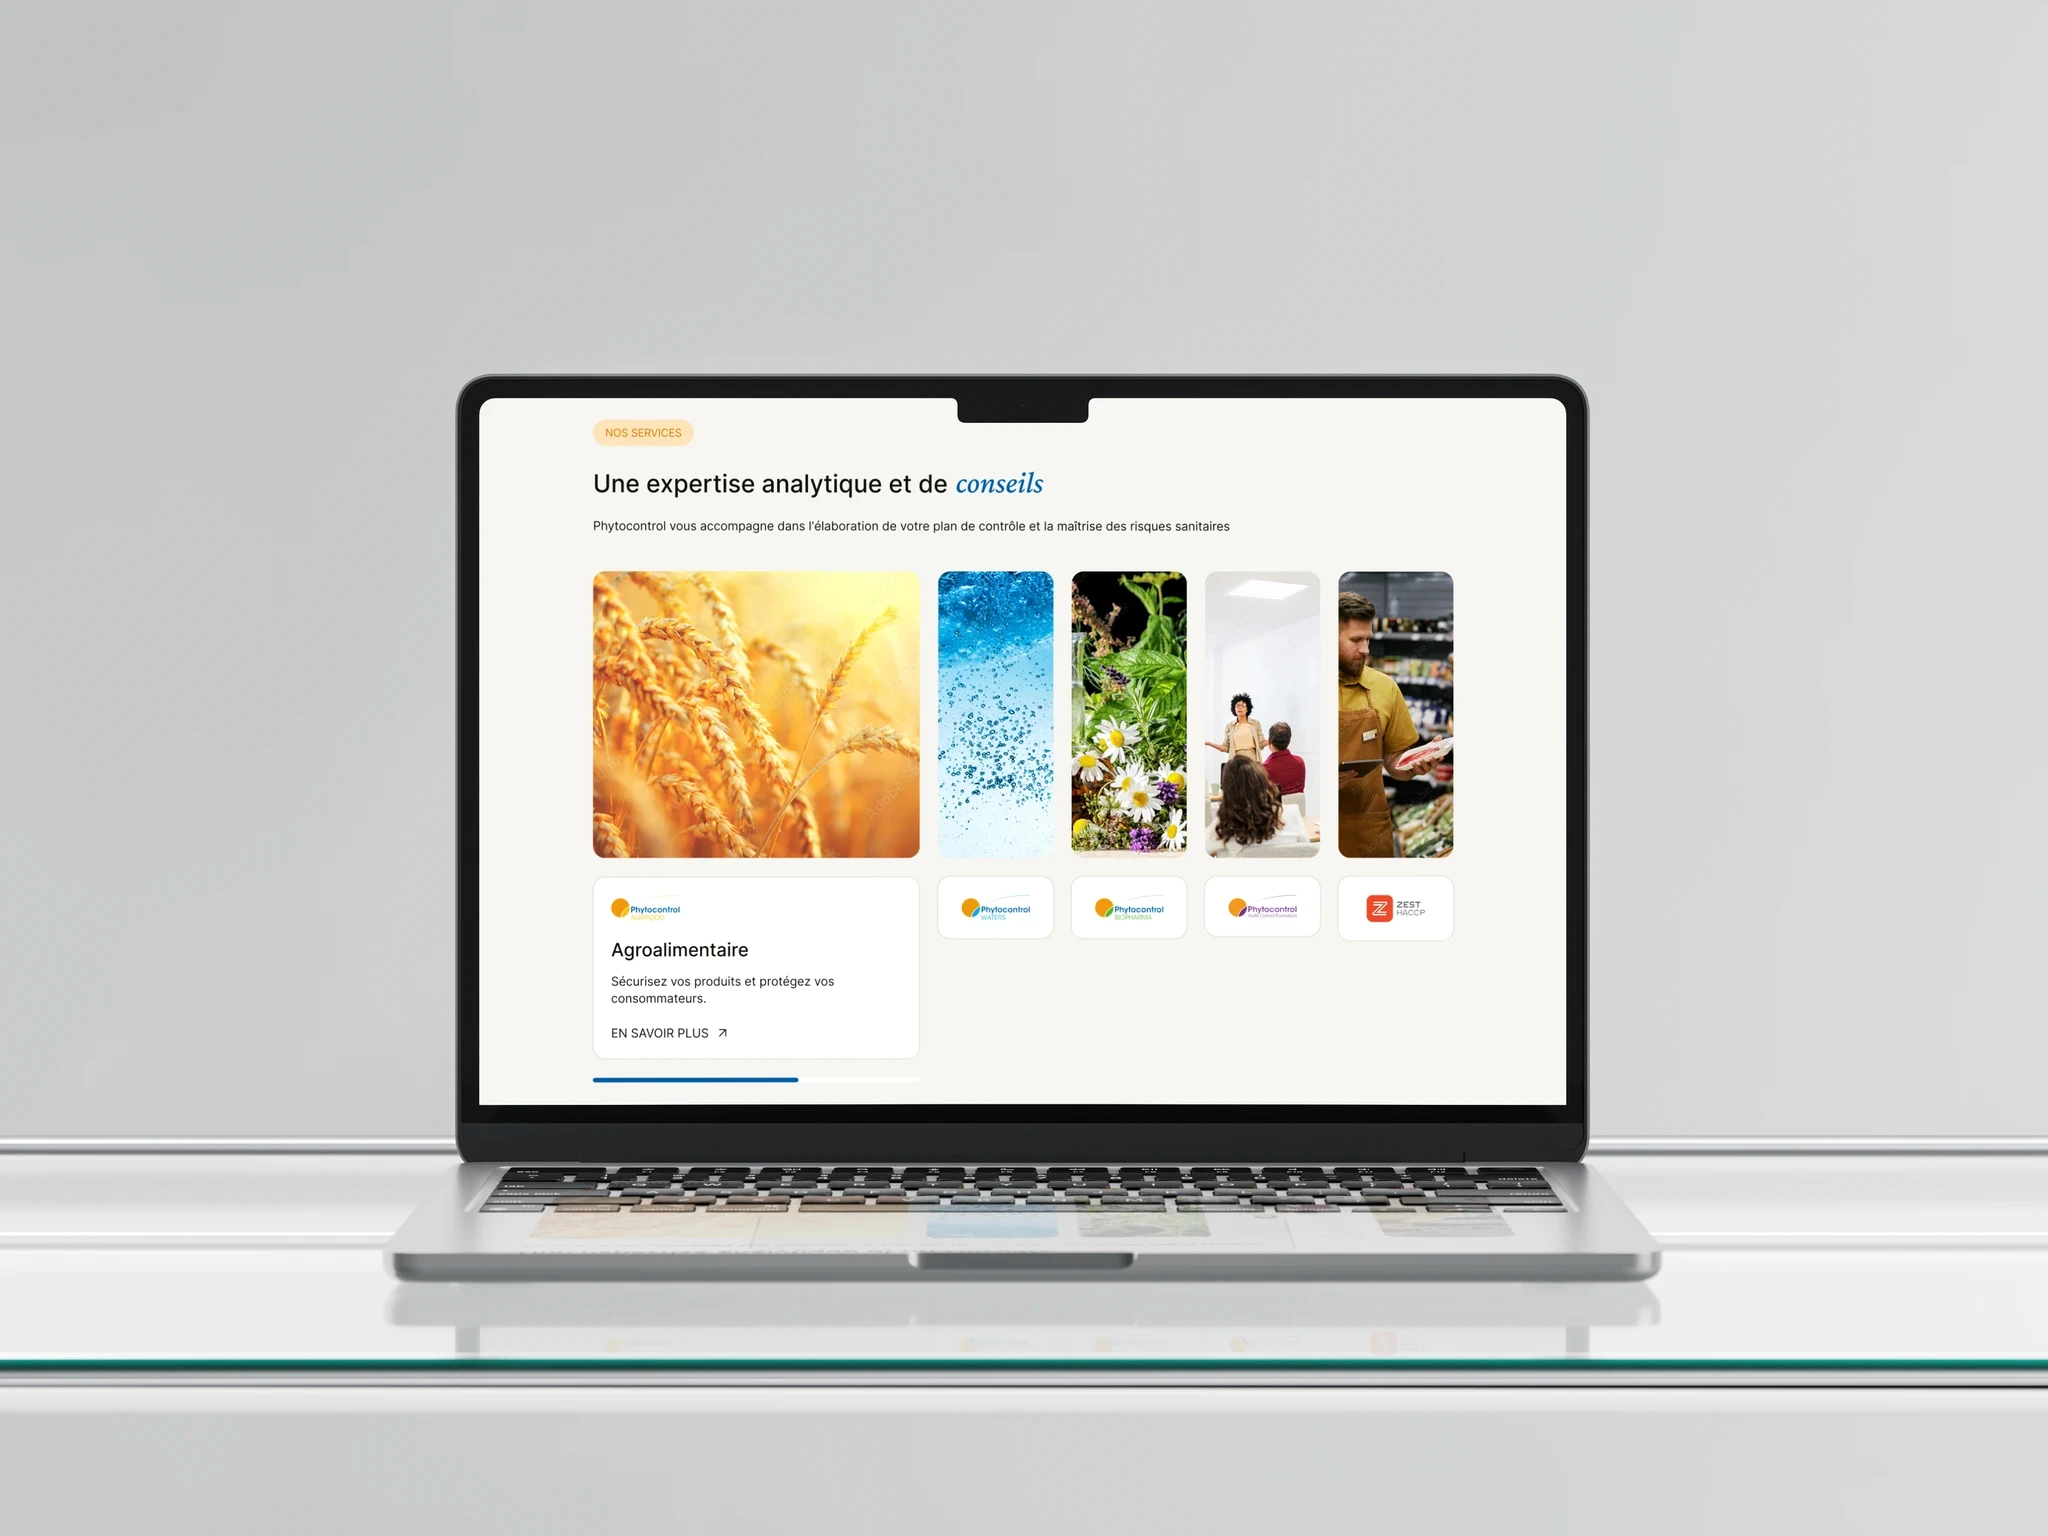
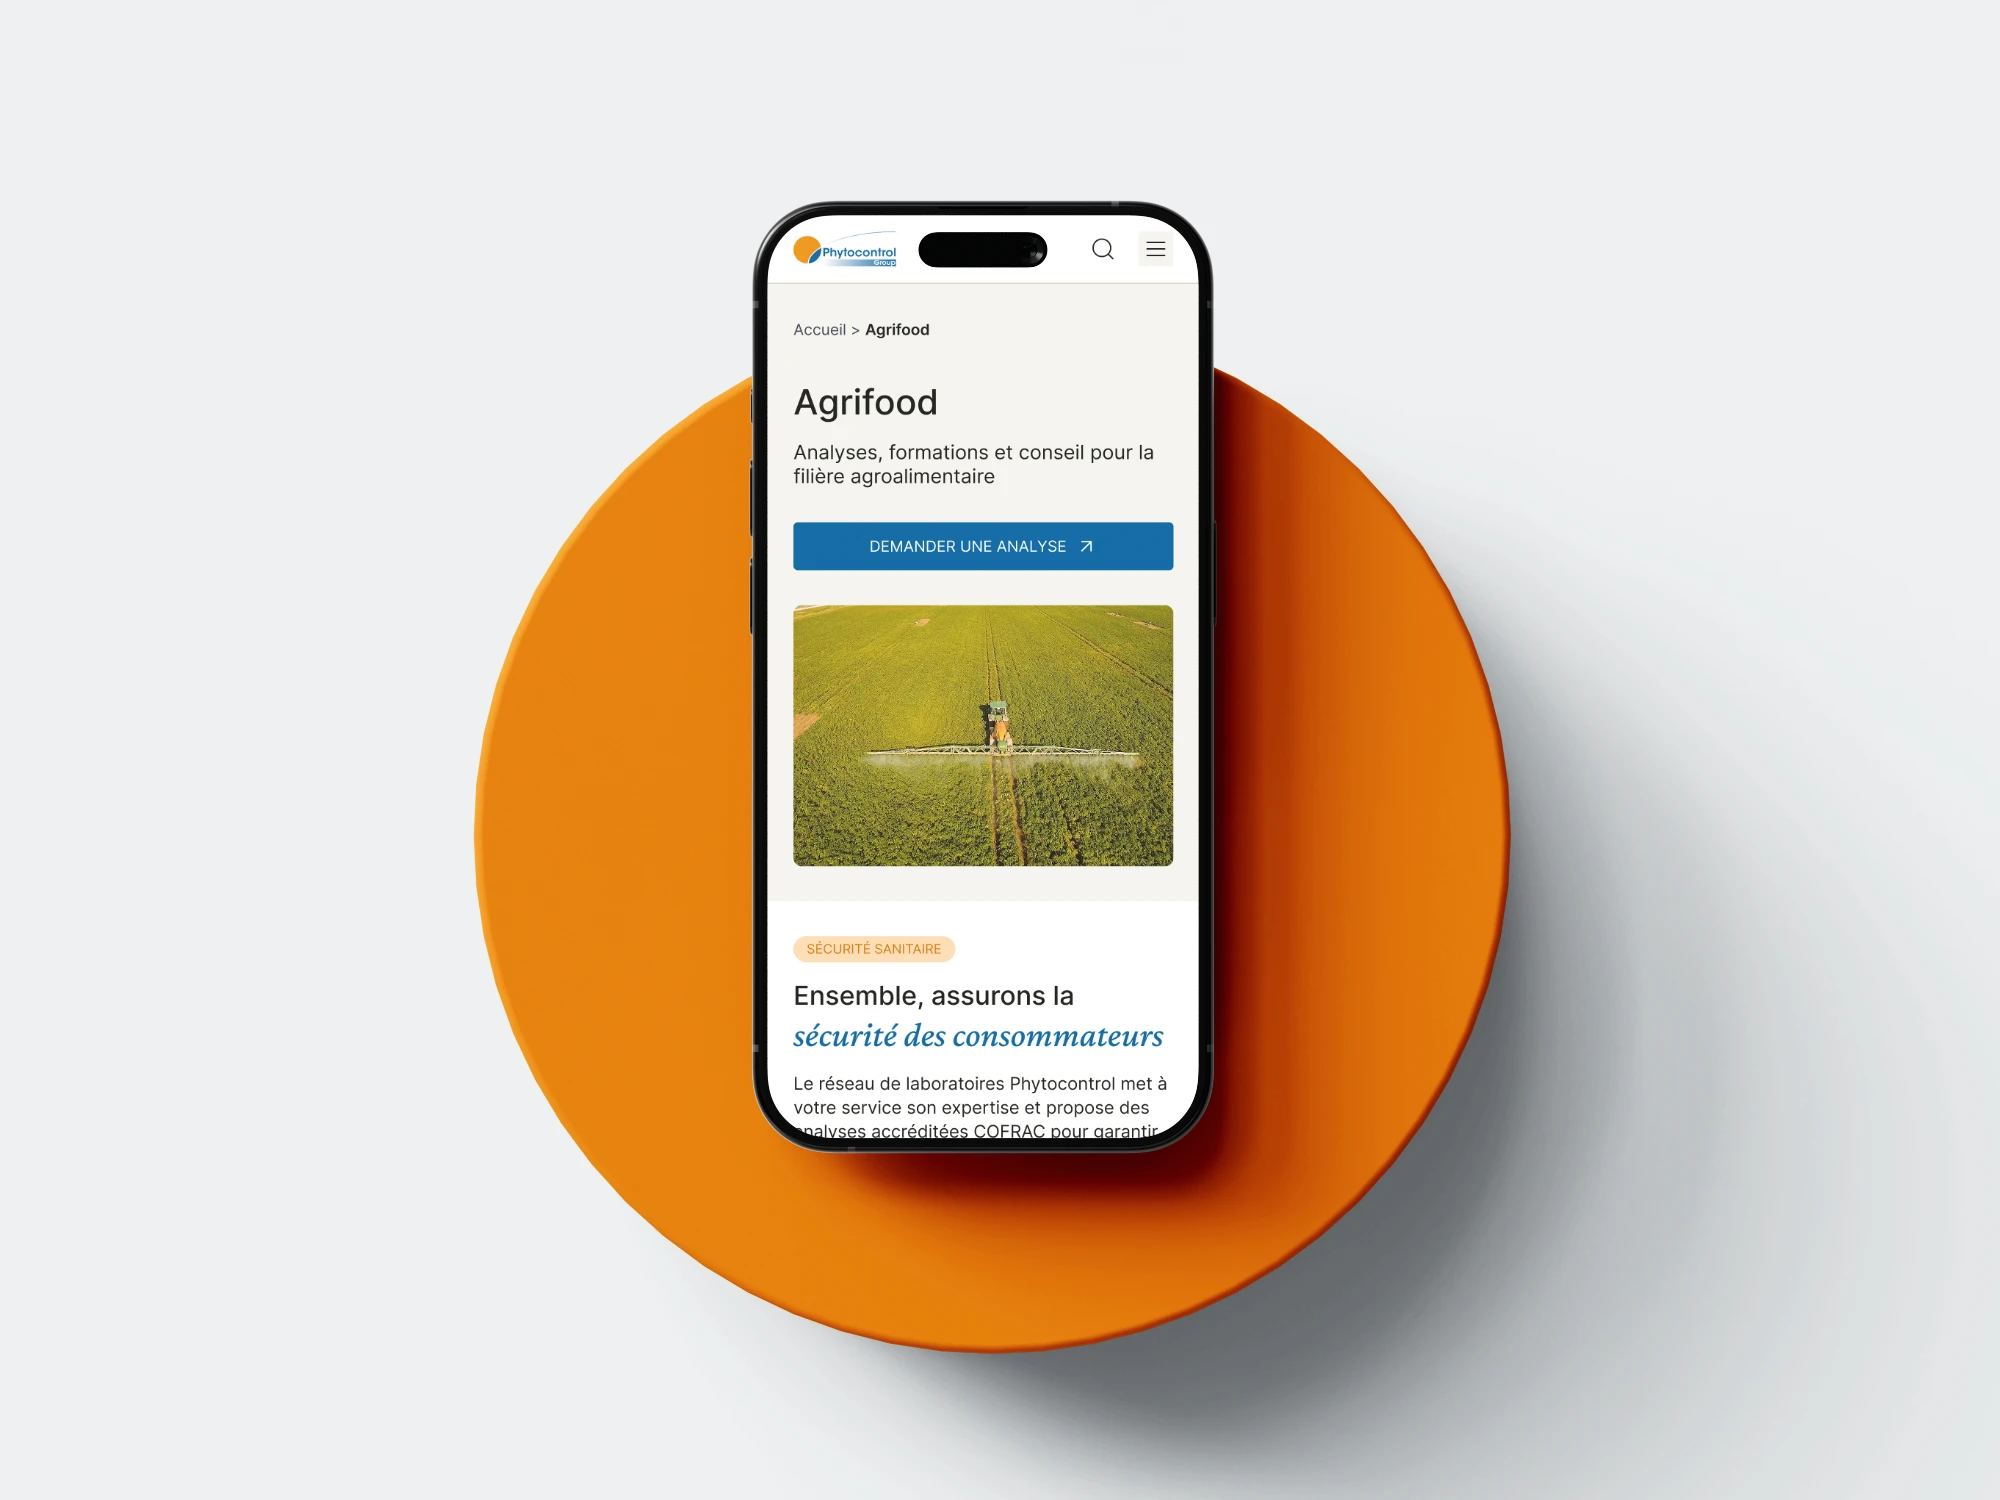
Guidance for sustainable change
Designing a centralized medical dashboard interface

Laboratory
Food safety
2025
UX
Workshops
Wireframe
Redesign
Brief & Objectives
The project's goal was to redesign the entire website through a stronger visual identity and a more intuitive user experience. The redesign aimed to clarify the brand's offering, improve content accessibility, and create a more distinctive digital presence.
Key objectives
Understand and structure the content: identify the key information, prioritize what should be highlighted, and create a clearer content hierarchy.
Improve the user experience: simplify navigation and create a more intuitive, user-friendly journey across the website.
Strengthen the brand identity: develop a distinctive visual direction that reinforces the laboratory's image and sets it apart from its competitors.
Process
Stakeholder Insights – Conducted interviews and workshops with medical reps and commercial teams to capture needs
Wireframing – Created wireframes to structure the information architecture and navigation
Validation – Iteratively reviewed and validated wireframes with stakeholders
Visual Identity – Designed a clear and professional visual identity adapted to the medical contex
User Testing – Conducted testing sessions on iPads with a panel of users, then refined based on feedback
Outcome
A centralized digital platform that helps medical representatives access and present all key information when meeting healthcare professionals
A streamlined user journey making navigation faster and more intuitive
A visual identity that reinforces professionalism and brand credibility
Designing a centralized medical dashboard interface
Laboratory
Food safety
2025
UX
Workshops
Wireframe
Redesign
Brief & Objectives
The project's goal was to redesign the entire website through a stronger visual identity and a more intuitive user experience. The redesign aimed to clarify the brand's offering, improve content accessibility, and create a more distinctive digital presence.
Key objectives
Understand and structure the content: identify the key information, prioritize what should be highlighted, and create a clearer content hierarchy.
Improve the user experience: simplify navigation and create a more intuitive, user-friendly journey across the website.
Strengthen the brand identity: develop a distinctive visual direction that reinforces the laboratory's image and sets it apart from its competitors.
Process
Stakeholder Insights – Conducted interviews and workshops with medical reps and commercial teams to capture needs
Wireframing – Created wireframes to structure the information architecture and navigation
Validation – Iteratively reviewed and validated wireframes with stakeholders
Visual Identity – Designed a clear and professional visual identity adapted to the medical contex
User Testing – Conducted testing sessions on iPads with a panel of users, then refined based on feedback
Outcome
A centralized digital platform that helps medical representatives access and present all key information when meeting healthcare professionals
A streamlined user journey making navigation faster and more intuitive
A visual identity that reinforces professionalism and brand credibility
Key figures
0%
0%
wireframes designed and iterated
0
0
validation workshops with stakeholders
0
0
months from initial research to final validated prototype
Process
Stakeholder Insights – Conducted interviews and workshops with medical reps and commercial teams to capture needs
Wireframing – Created wireframes to structure the information architecture and navigation
Validation – Iteratively reviewed and validated wireframes with stakeholders
Visual Identity – Designed a clear and professional visual identity adapted to the medical contex
User Testing – Conducted testing sessions on iPads with a panel of users, then refined based on feedback
Outcome
A centralized digital platform that helps medical representatives access and present all key information when meeting healthcare professionals
A streamlined user journey making navigation faster and more intuitive
A visual identity that reinforces professionalism and brand credibility


Map
Map
Map

Map
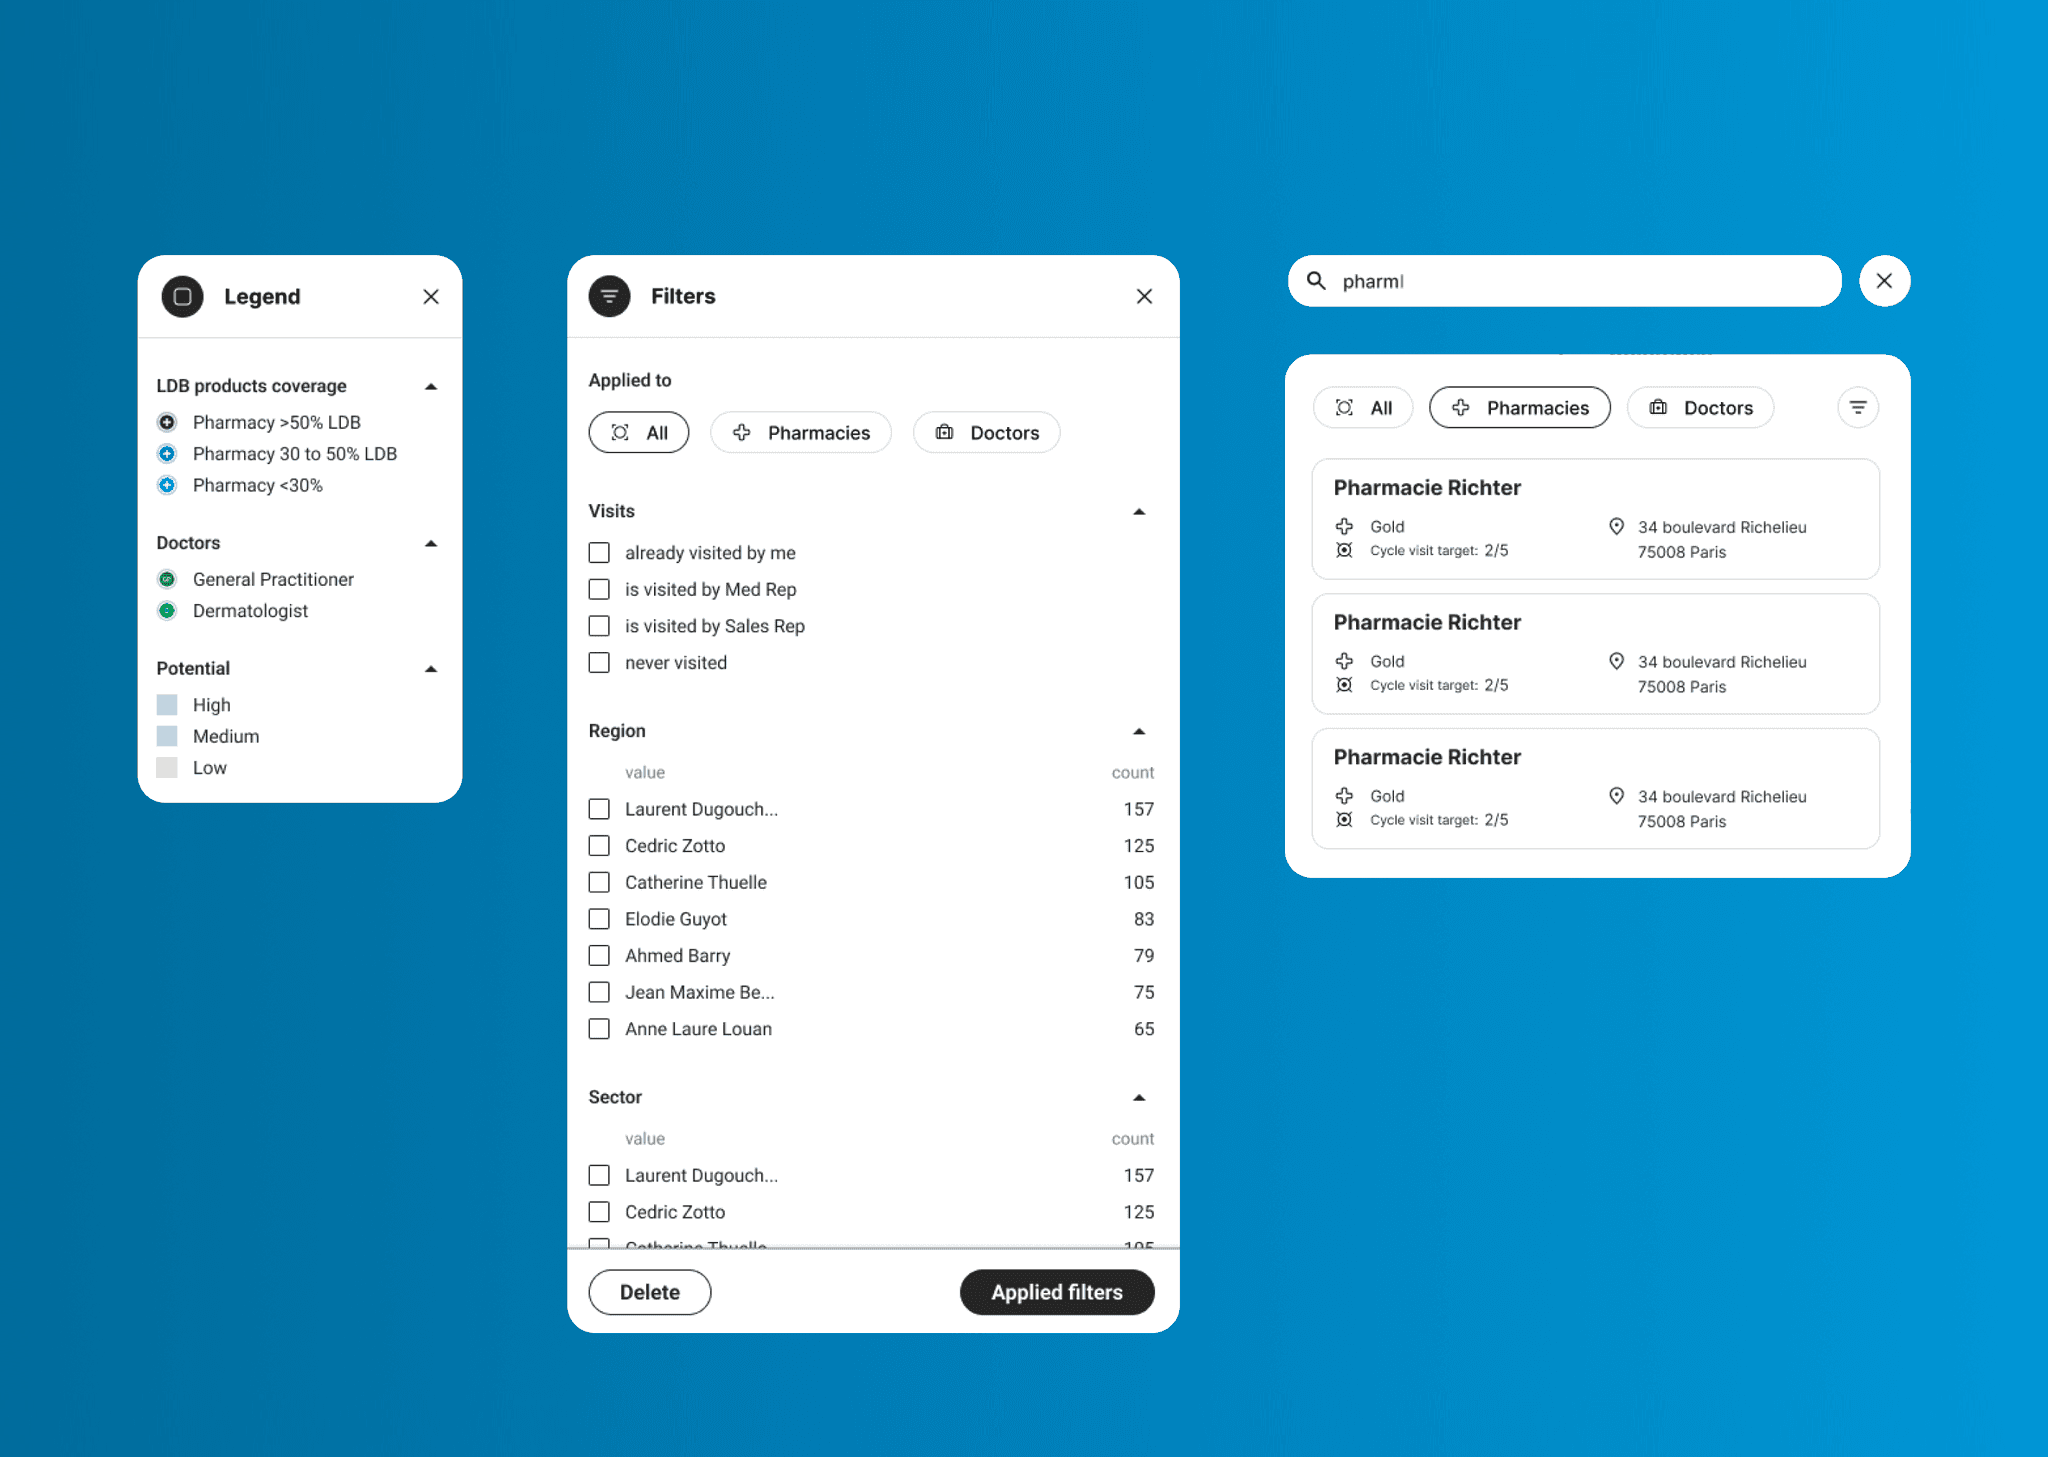
Filter panel
Filter panel
Filter panel
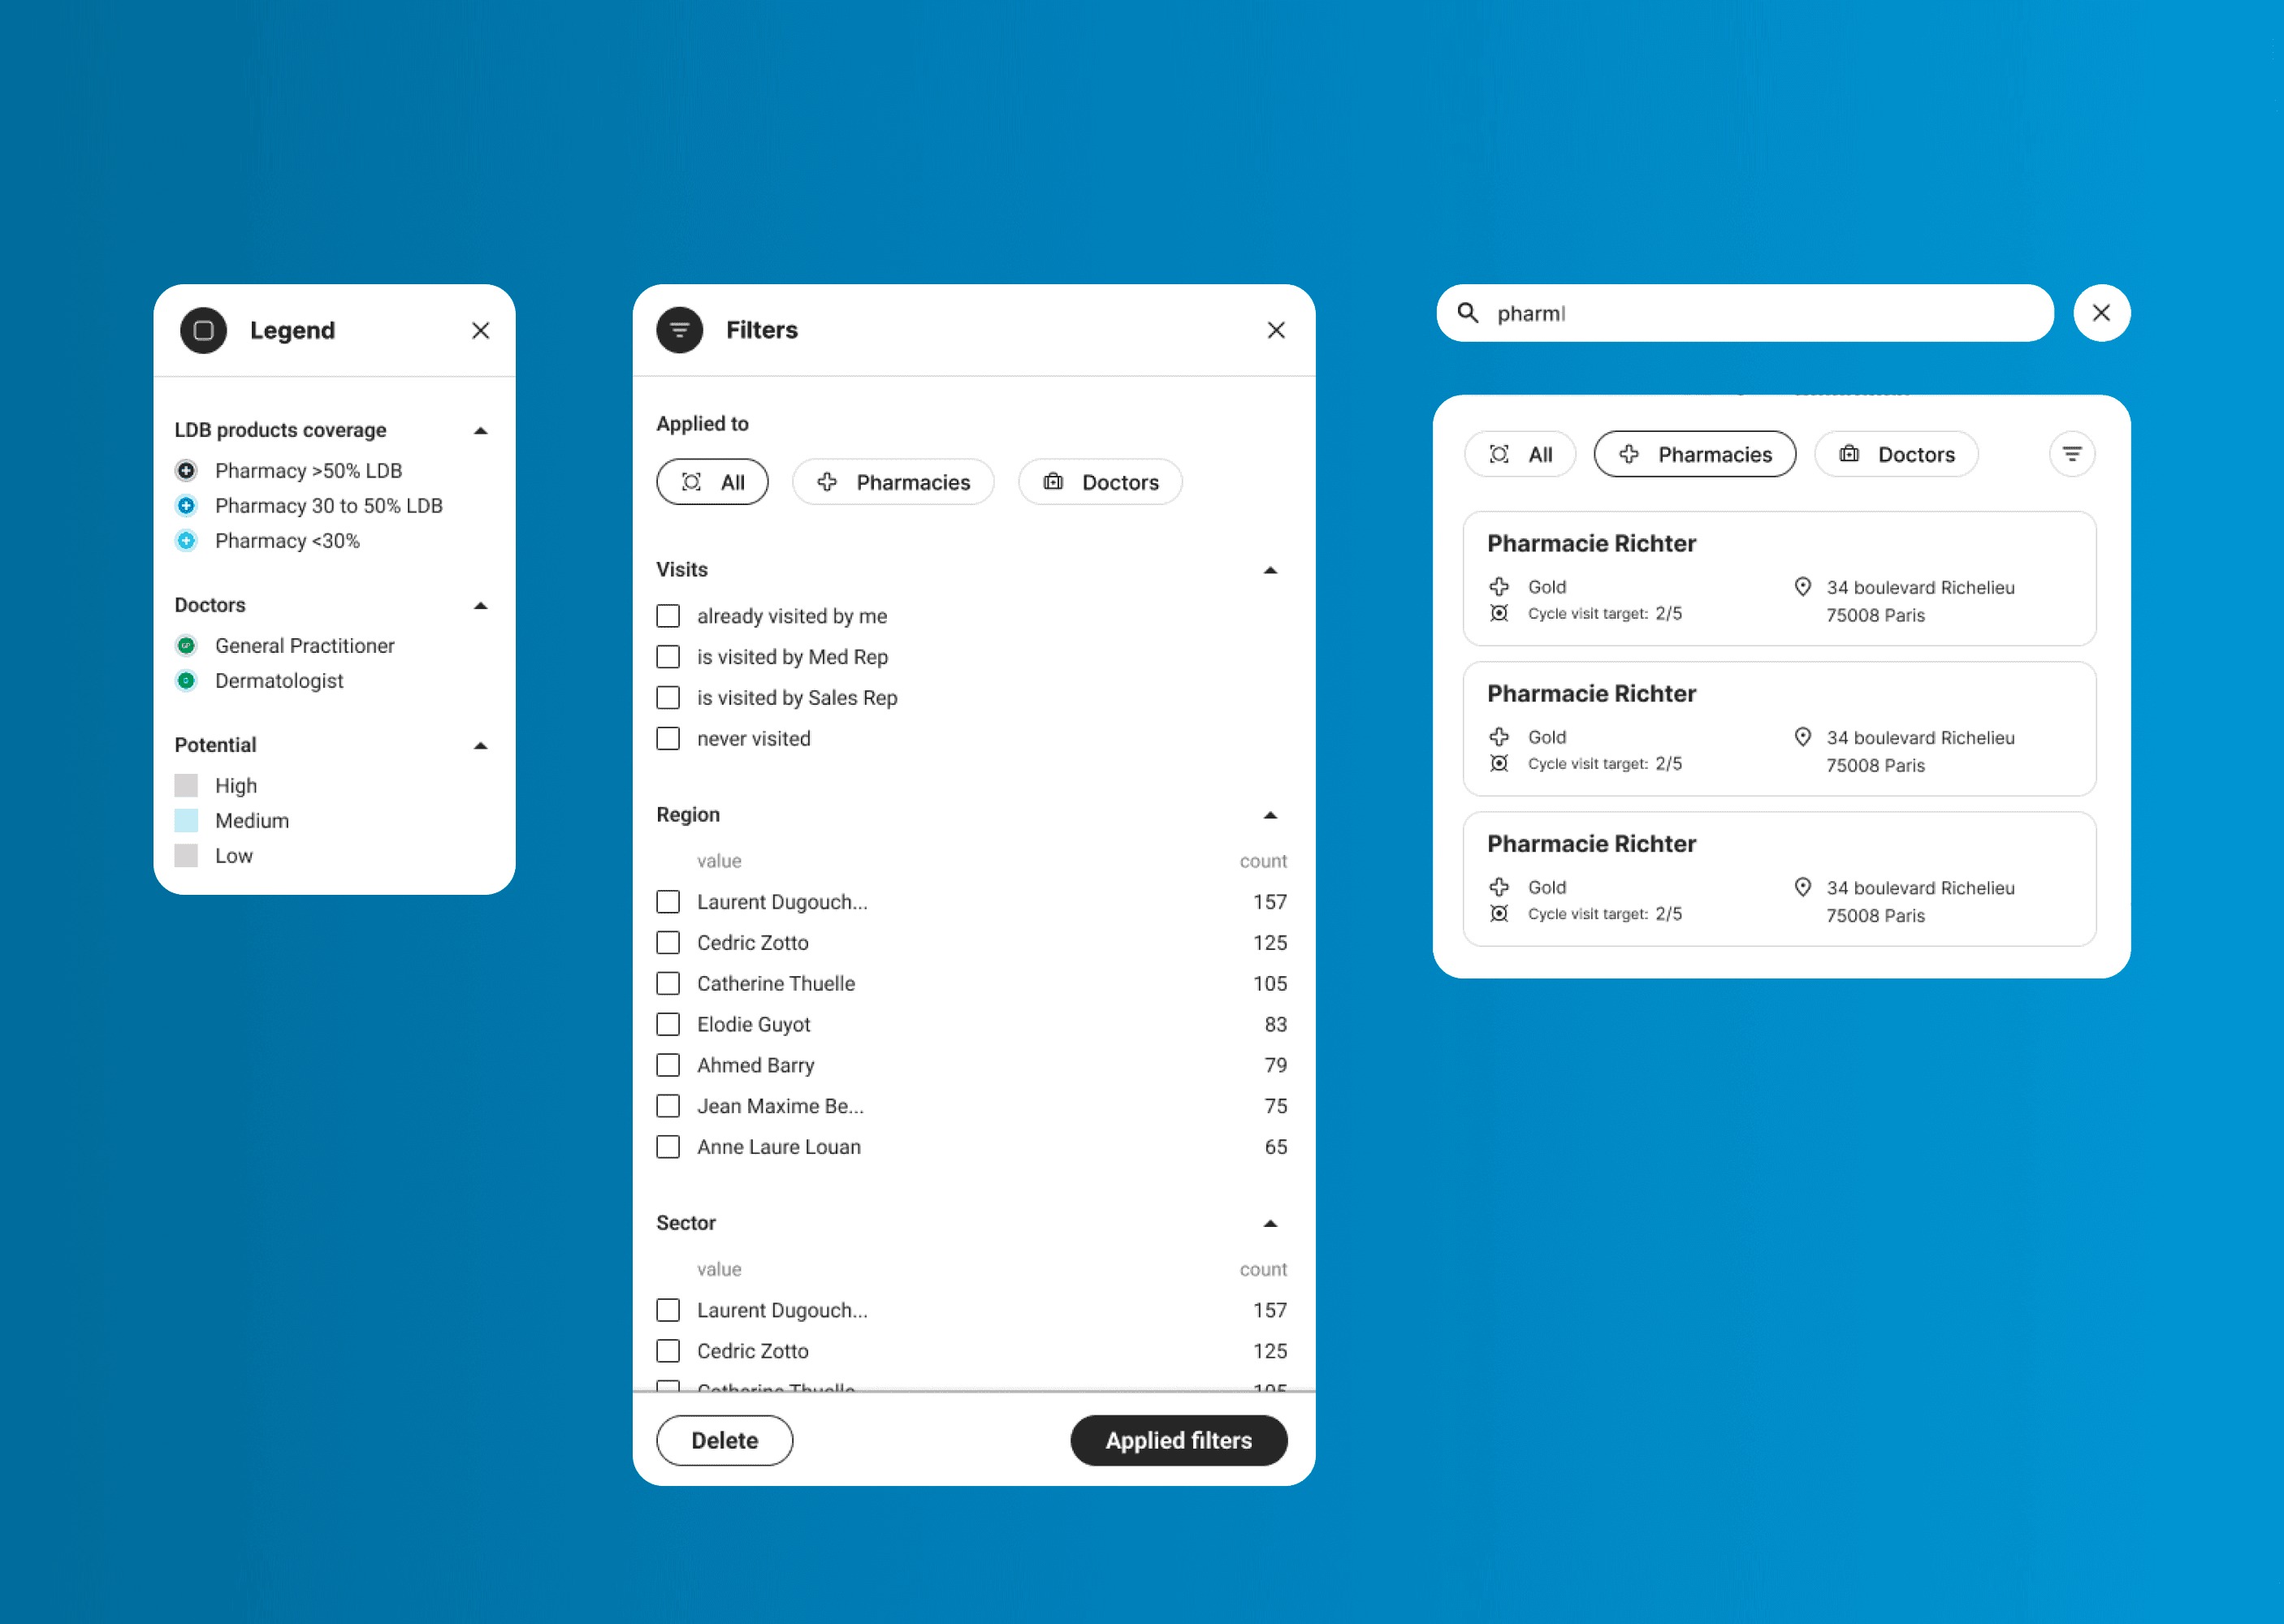
Filter panel
Creating visual identity
& Campaign tracking
0%
0%
increase in data centre energy consumption over the last 5 years
x0
x0
the carbon footprint of digital technology by 2050 if no sobriety measures are taken
0%
0%
of global CO₂ emissions in 2025 from digital technology
Source: Green IT studies & Ademy
Projects
You might also like

Projects
You might also like
Projects
You might also like
Projects